Keeping our LLM in the game - a visual history of changes
When using LLMs to help us write code, we want to have an overall understanding of the code, and significant details. We do not necessarily want to read all the code. In an earlier experiment we had to throw away what was generated, and that is something we want to avoid. We use moldable development and build lots of small tools that help us see if we're moving in the right direction. Let's build a simple one taking a look at the commit log, and showing for each code file for each commit where it was changed the number of additions and deletes.
The git log
In GToolkit, we have a notebook called Lepiter that allows us to integrate shell scripting and smalltalk programming. If I set the repoLocation I can use that in the shell script, and by setting the binding to changes, I can refer to the output of the shell script in smalltalk again.
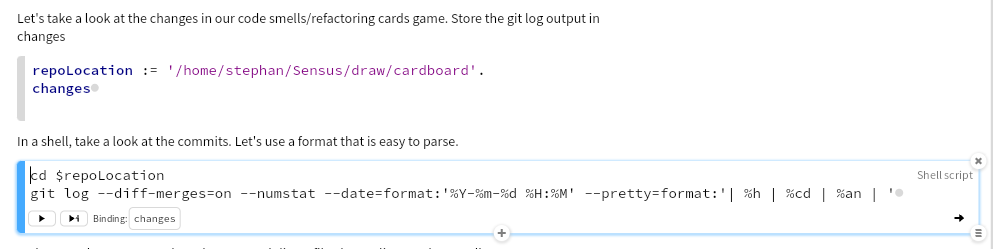
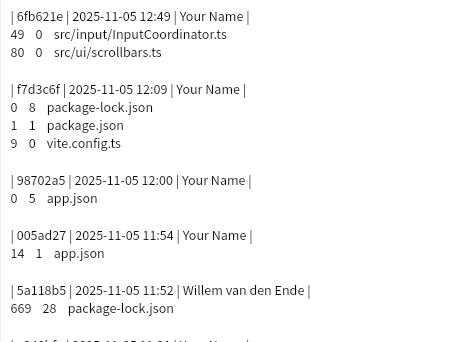
Git log has a bewildering number of options, so it took some trial and error to get a format that would be easy to parse. Commits separated by an empty line, and consisting of one line with the short hash, date and committer, and then for each file that was changed the number of added lines, deleted lines and the file path.This one looks like:
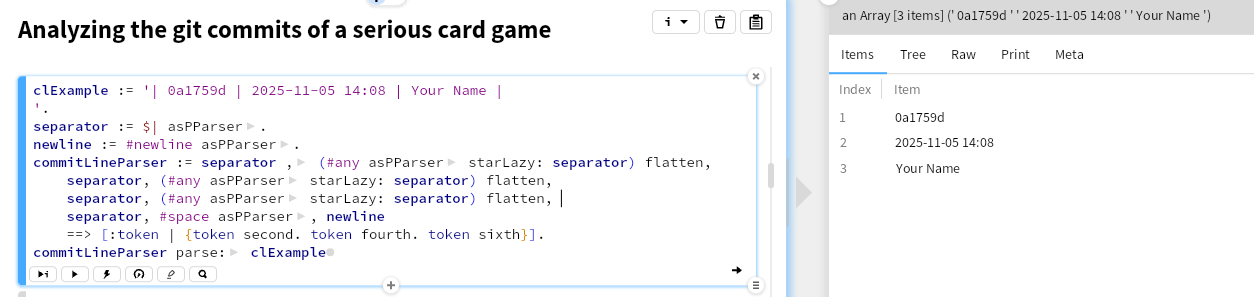
Parsing
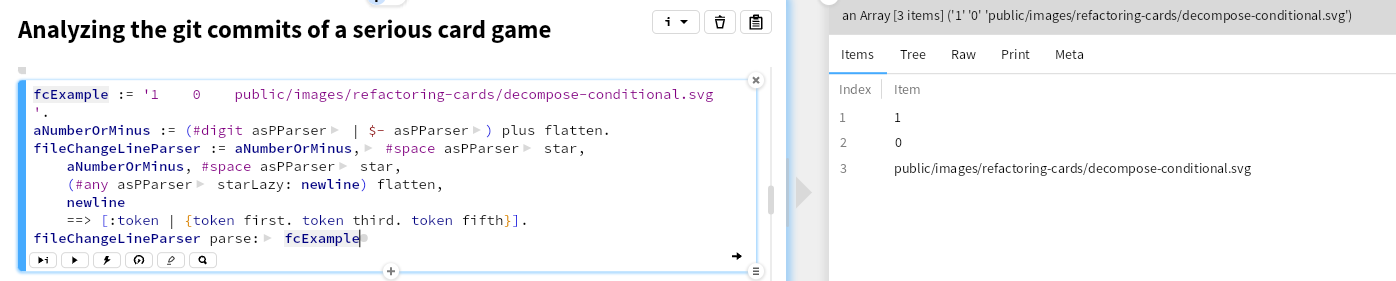
GToolkit has good parser support. Here we'll use PetitParser2. That allows us to easily combine parsers. First let's take a look at parsing a commit line. starLazy: might not be familiar, that parses the element before it repeatedly until its parameter is found.
Next parse a file change line
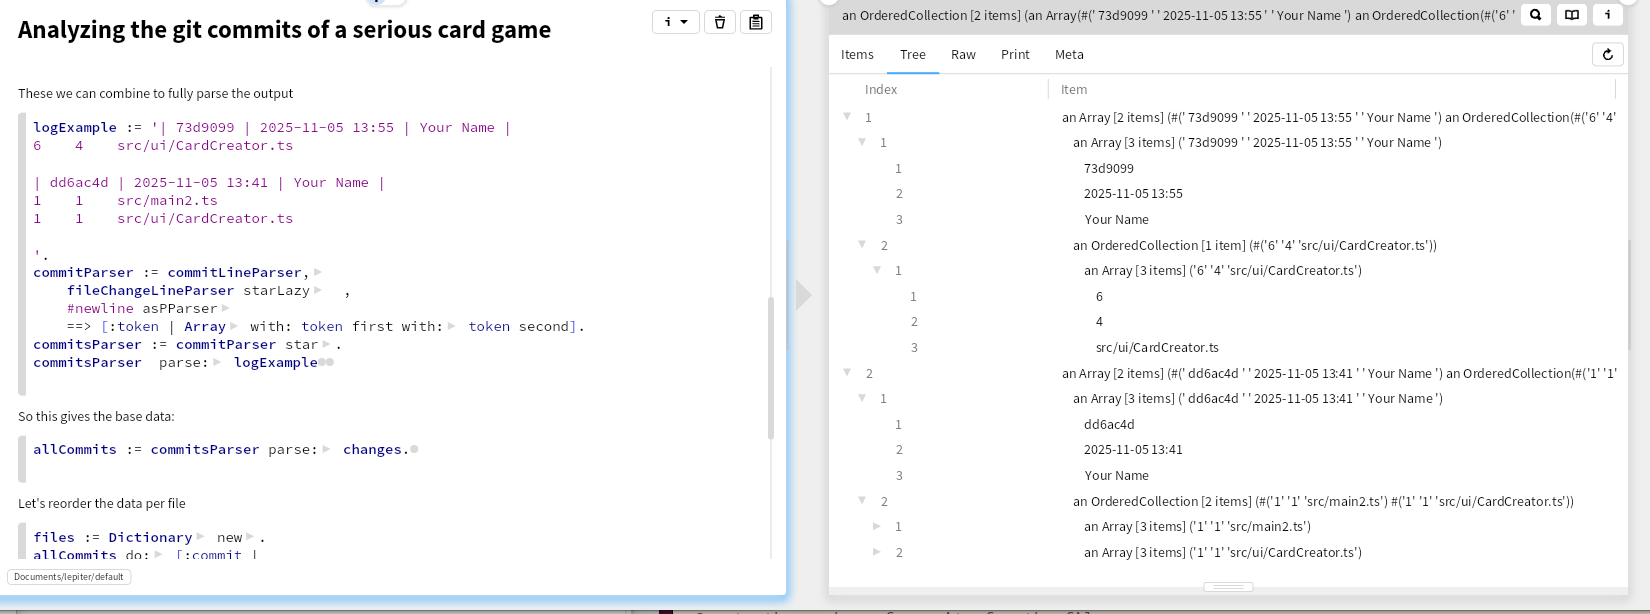
These can then be combined
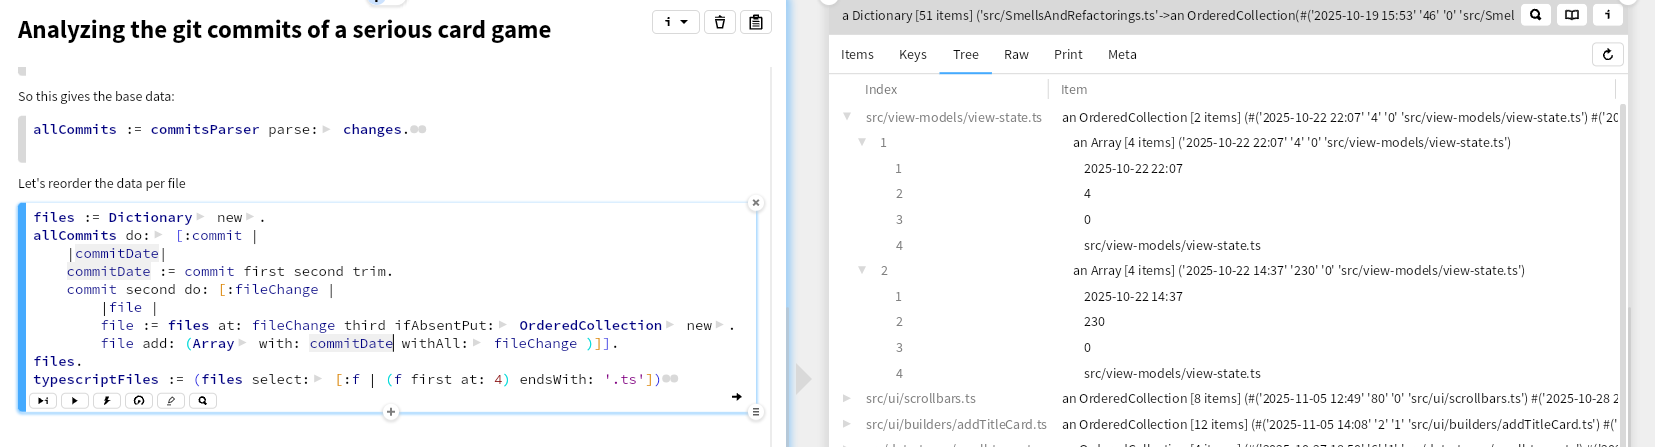
In this way we have the data as files per commit. We can reorder that to have the changes per file, and select here only the typescript files. We have a serious primitive obsession smell here, using the basic collections and using indexes instead of proper classes and names, but that is for later.
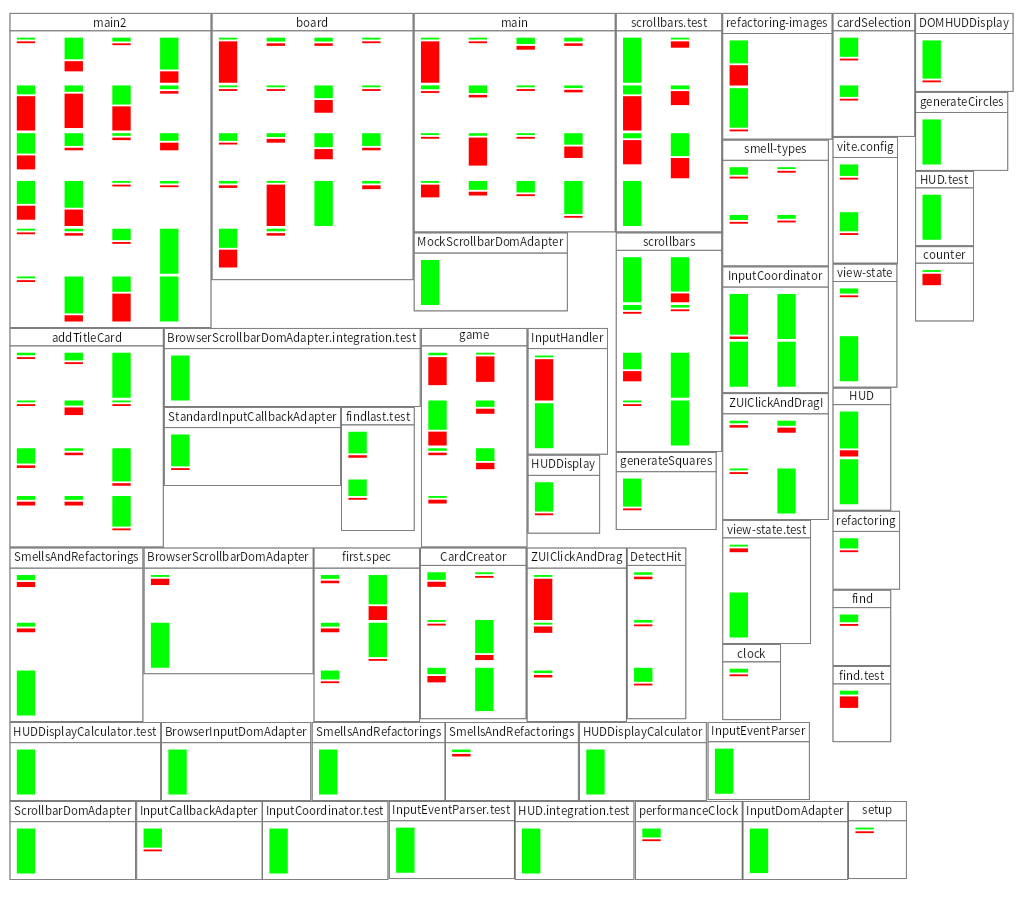
Visualization
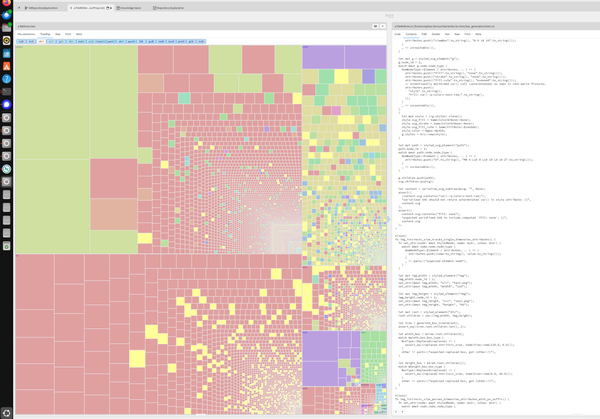
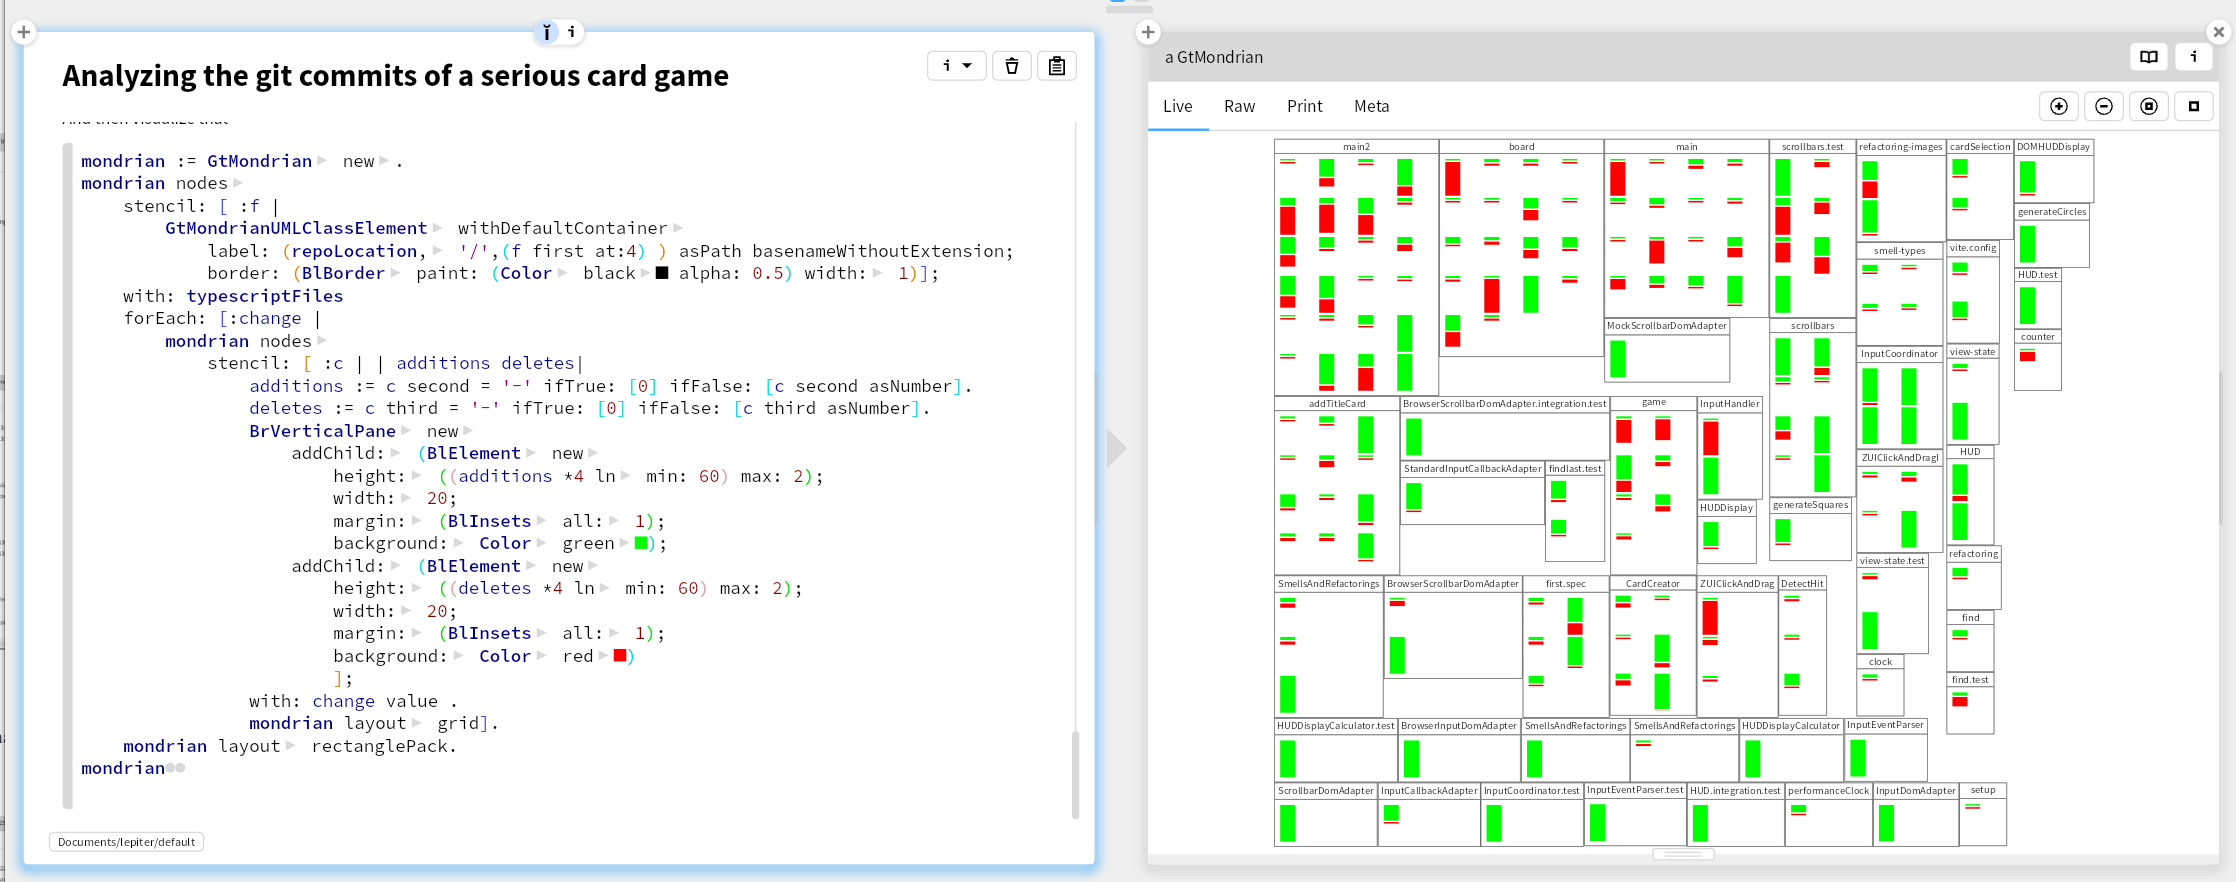
We can then make a Mondrian visualization. For each file, put a rectangle with a file name label in it (like in an UML class). Within that rectangle, put for each commit that changed that file, a stacked rectangle of in green the additions and in red the deletes. Layout them in a grid with the newest commit top left. Again a primitive obsession where we should introduce class extracting the vertical pane with its stacked green and red bar.
Conclusion
This visualization shows us that about half of the files were created and then have had little change. On the other hand, it looks like we have some hot spots, that we need to take a better look at to see if we should redistribute responsibilities. Looks like we'll need to write some more tools 😄